by Maksym Dmitriiev

 Below is recommended configuration for TWAMP Control channel
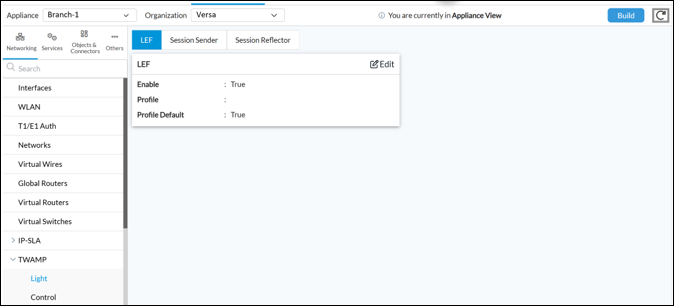
 For the child session which will actually measure path characteristics use the following configuration under Device Template (or service template) -> Networking -> TWAMP -> Light.
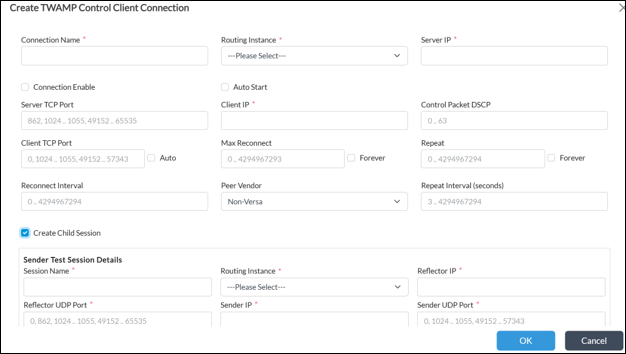
* When first configuring it, you should click “Create Child Session” from Control session menu as per below screenshot.
For the child session which will actually measure path characteristics use the following configuration under Device Template (or service template) -> Networking -> TWAMP -> Light.
* When first configuring it, you should click “Create Child Session” from Control session menu as per below screenshot.
 Child session configuration should be the following:
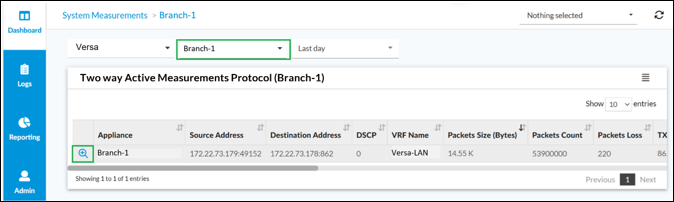
 Select your appliance and click on magnifying glass icon to see details of the datapath measurement.
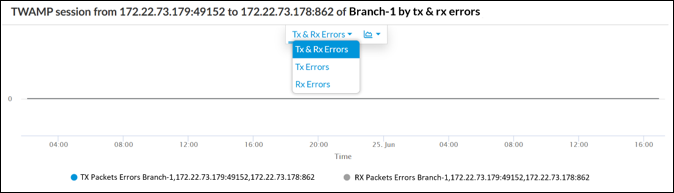
 Data such as Two way delay, Forward & Reverse Delay, jitter or delay variation, TX & RX packets and errors for selected time interval will appear. Additionally on the bottom of Analytics section you can find similar aggregated statistics in a table view.


Two-Way Active Measurement Protocol (TWAMP) is a standard protocol, defined in RFC 5357, that is used to measure network performance. It is used for network SLA compliance checks between Versa VOS and a 3rd party appliance which supports TWAMP protocol. Administrators can use TWAMP Control along with TWAMP Light for periodic network monitoring and on-demand network quality checks. TWAMP cannot be used for automatic traffic steering decisions or data path change, however you can consider measurement results for network optimization tasks. Versa VOS also supports TWAMP Light only for the use case where TWAMP Control is not required or not supported by 3rd party appliance.
1. TWAMP protocol overview
Versa Operating System (VOS) provides flexible support of TWAMP protocol, enabling operators to accurately measure end-to-end network performance and assure service quality. VOS supports two modes of TWAMP:- Full TWAMP implementation includes a Control channel along with test sessions (child sessions) for datapath performance measurement. This is a standard operational mode that provides comprehensive, standards-compliant visibility and is ideal for multi-vendor environments where interoperability is critical.
- TWAMP Light implementation is a lightweight mode that eliminates the need for a Control channel while still delivering accurate datapath performance measurements (e.g., latency, jitter, packet loss).
2. TWAMP configuration example on VOS
Configuring Full TWAMP mode includes two steps. The first step is TWAMP Control connection configuration and the second step is child sessions configuration. To configure the TWAMP Control connection open the Device Template (or service template) then navigate to Networking -> TWAMP -> Control and click on +Add to create a new TWAMP Control session.
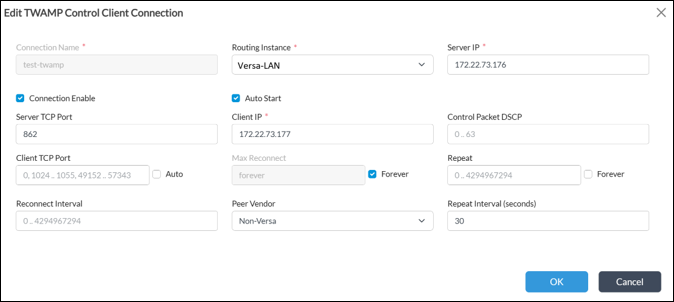
Below is recommended configuration for TWAMP Control channel
- Enable Connection
- Auto Start should be enabled
- Select Routing Instance from where to initiate the connection
- Server IP is a remote peer IP or receiver IP
- Client IP is a Sender IP from where the session will be initiated
- Set Server TCP port
- Enable Max Reconnect
For the child session which will actually measure path characteristics use the following configuration under Device Template (or service template) -> Networking -> TWAMP -> Light.
* When first configuring it, you should click “Create Child Session” from Control session menu as per below screenshot.
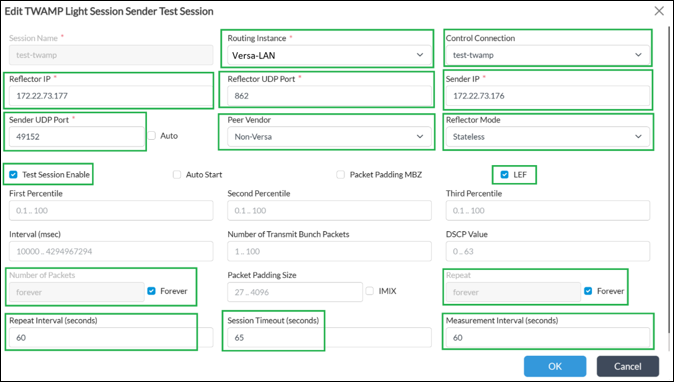
Child session configuration should be the following:
- Enable True
- Profile default True
- Select Routing Instance
- Control Connection that is used for control of a child session
- Reflector IP is a Sender IP from where the session will be initiated
- Reflector UDP port is 862 as per standard
- Sender IP is a remote peer IP or receiver IP
- Sender UDP port 49152 is a recommendation to have single source port in order to simply identify the related child session in Analytics
- Peer Vendor is Non-Versa
- Reflector mode set to stateless (as child sessions will start, measure, stop lifecycle and not a permanent)
- Enable Test Session
- Enable LEF for logging to Analytics
- Number of packets forever
- Repeat forever
- Repeat interval set to 60
- Session timeout 65
- Measurement interval 60
3. Cisco configuration example
In this scenario Cisco router acts as TWAMP Responder with Control Server. The below configuration enables TWAMP to accept Control Channel session on UDP port 862. Once Control Channel is UP, Cisco router will act as a session reflector, which will dynamically respond to test sessions initiated by VOS.ip sla responder twaamp ip sla responder twamp-control 862
4. Versa Analytics data for TWAMP
Open Analytics menu. Navigate to Dashboard -> System -> Measurements
Select your appliance and click on magnifying glass icon to see details of the datapath measurement.
Data such as Two way delay, Forward & Reverse Delay, jitter or delay variation, TX & RX packets and errors for selected time interval will appear. Additionally on the bottom of Analytics section you can find similar aggregated statistics in a table view.


