Author: Andrey Bazovkin
1 Introduction and Problem Statement
The Versa Operating SystemTM (VOSTM) software by default monitors the state of all available SD-WAN paths by running SLA probes over them. Log events can be generated whenever a SD-WAN path goes down, or certain SLA is violated (in case there’s an SLA profile configured). There can be a scenario when it’s needed to proactively identify eventual health problems with the particular transport link. In case of a Full-mesh topology (including Spoke-to-Spoke Direct scenarios in Hub-and-Spoke topologies), default SD-WAN SLA probes may generate lots of alarms, because even single transport link issue on a site will affect many SD-WAN paths from it. Additionally to note that SD-WAN SLA probes monitor end-to-end connectivity between sites, so they would reveal any eventual problem on the path, which may not always be related to transport link on this site.This article provides an overview on how “Active SaaS Application Monitoring” feature on VOS can be leveraged as a possible solution for the eventual Transport link problem identification.
Screenshots and configuration examples in this article are made in Versa Director, Analytics and VOS 22.1.4.
2 Configuring Active SaaS Monitoring
2.1 Approach overview
In general scenario Active SaaS application monitoring collects performance metrics about an organization’s or a tenant’s WAN links and uses the metrics to help determine the best path to a SaaS application or any arbitrary IP address or FQDN.
So for transport link monitoring scenario there can be 2 tiers of monitoring leveraged:
1) Towards any IP within ISP infrastructure – it may provide performance metrics and eventual problems specific rather to the last mile.
2) Towards some public service, which uses Anycast IPs (for example, Google DNS) – additionally to the first monitor, it may provide performance metrics and eventual problems covering both – last mile and ISP uplinks. It will also depend on that public Anycast IP address as well, however usually it’s expected to be the most reliable external destination.
Of course, it’s possible to use only one monitor from those two mentioned above, however having them both may better precise the source of the eventual problem with the Transport link.
Active SaaS application monitors can use ICMP, TCP or HTTP probes. Usually ICMP probes provide more accurate packet loss statistics, while TCP and HTTP probes provide better statistics for Service state, and also they’re not affected to eventual ICMP rate-limiting issues.
So for the purpose of current scenario to monitor transport link health, ICMP probes would be the first choice unless there are issues with ICMP rate-limiting in transit or on monitored destination.
Note: those Active SaaS application monitors can also be re-used for DIA traffic steering in SD-WAN Forwarding Profiles.
2.2 Configuring Active SaaS Application Monitoring
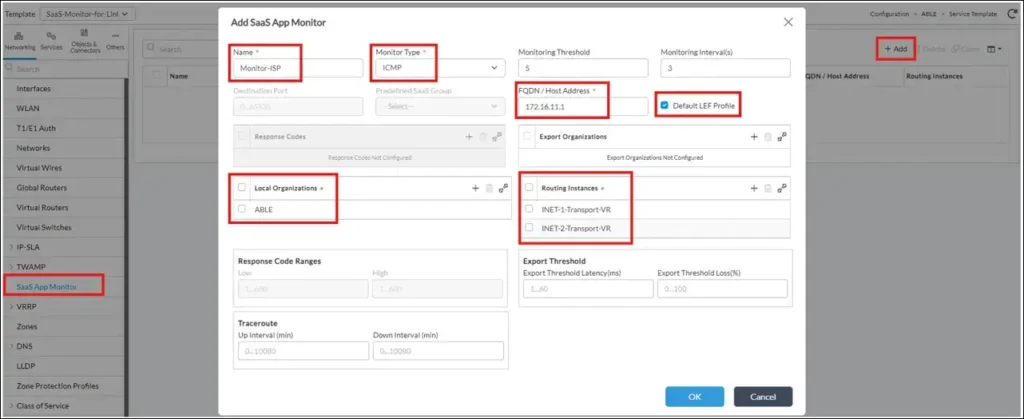
Active SaaS Application monitors are configured in Networking->SaaS App Monitor Configuration section.As discussed in section 2.1, we will create two monitors of ICMP type, one destined to local ISP IP, another – to Public service (Google DNS):
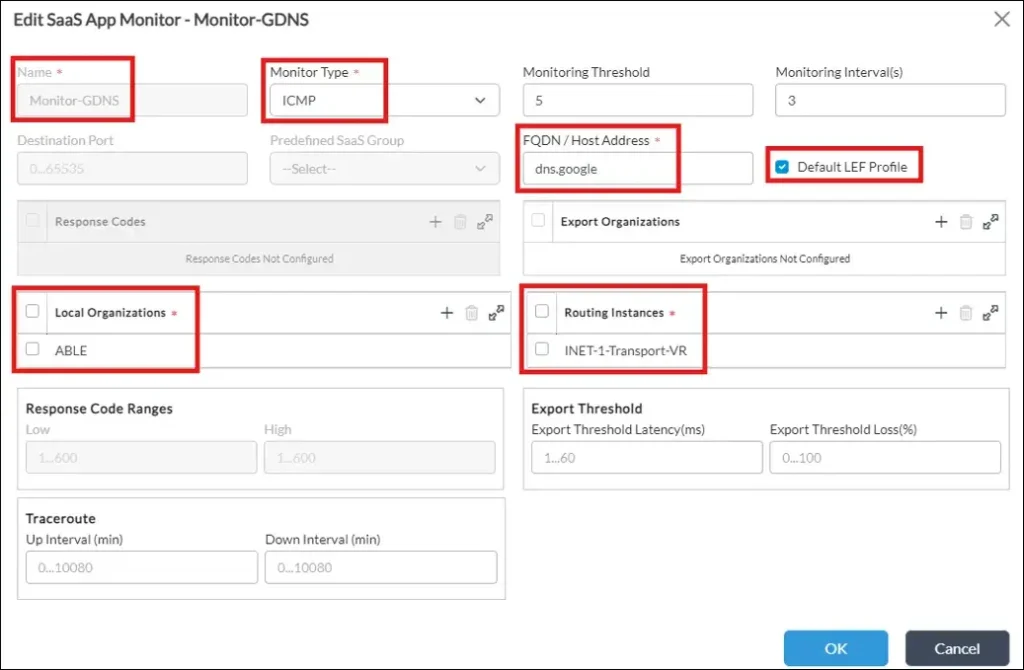
 And for Google DNS:
 So it’s needed to set:
• Monitor name
• Monitor type – ICMP
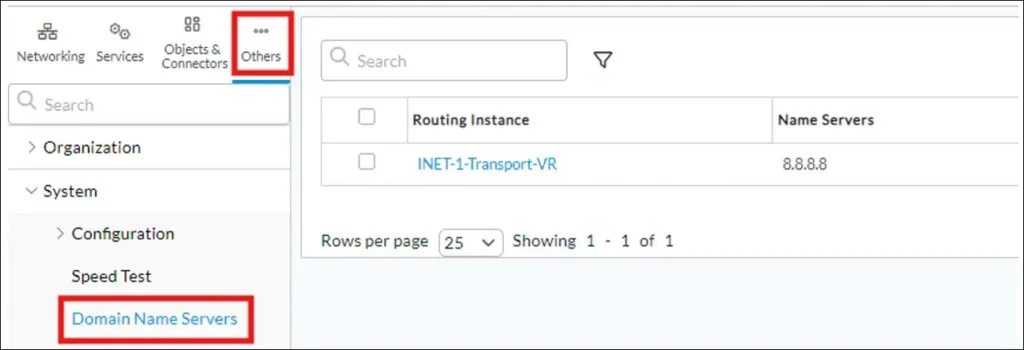
• FQDN or IP address. Note: if you put FQDN here, then DNS should be configured for each Routing Instance, where this Monitor will be applied, in Others->System->Domain Name Servers:
• Check “Default LEF Profile” to enable sending Monitor statistics to Versa Analytics
• Local Organization
• Routing Instance. Note: there can be several Routing Instances configured
After this newly created SaaS App Monitors will be collecting performance metrics.2.3 Verifying Active SaaS Application Monitoring
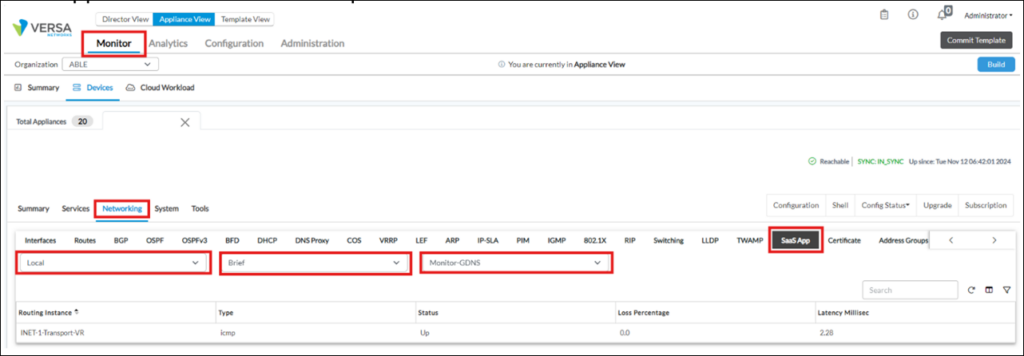
Once configured, Active SaaS Application monitors status can be verified in Versa Director Monitor dashboard or via VOS cli.In Versa Director UI go to Device->Monitor->Networking->SaaS App, and select “Local”, “Brief” and SaaS App Monitor name from drop-down list:
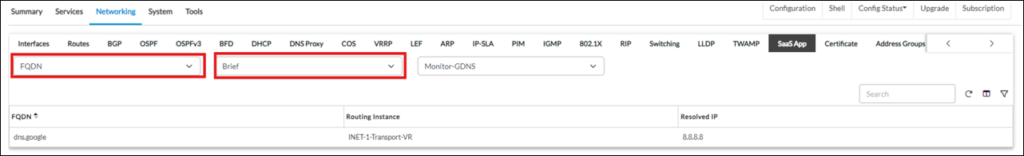
 Additionally it’s also possible to verify FQDN resolution, if FQDN was used as Monitor destination. Select “FQDN” and “Brief” from drop-down list on the screen above:
 From VOS cli those would be following commands:
• show application-monitor local brief
• show application-monitor fqdn brief
Example:
admin@ABLE-Spoke-INET-2-cli> show application-monitor local brief
APPLICATION                                      LOSS        LATENCY
MONITOR NAME  ROUTING INSTANCE     TYPE  STATUS  PERCENTAGE  MILLISEC
-----------------------------------------------------------------------
Monitor-GDNS  INET-1-Transport-VR  icmp  Up      0.0         2.23
Monitor-ISP   INET-1-Transport-VR  icmp  Up      0.0         0.65

admin@ABLE-Spoke-INET-2-cli> show application-monitor fqdn brief
APPLICATION                                                  SAAS
MONITOR NAME  FQDN         ROUTING INSTANCE     RESOLVED IP  GROUP
--------------------------------------------------------------------
Monitor-GDNS  dns.google   INET-1-Transport-VR  8.8.8.8      -
Monitor-ISP   172.16.11.1  INET-1-Transport-VR  172.16.11.1  -
2.4 Observing SaaS Application Monitor Link health historical statistics
Once configured, Active SaaS Application monitors historical statistics can be observed in corresponding Versa Analytics dashboard (available only from 22.1 release). For this you may need to navigate to Analytics Dashboard->SD-WAN->APM->Active APM: You can switch monitored parameter (Latency, Jitter, Packet Loss Ratio) in a drop-down menu on the graph.
3 Configuring Link Health Alarms based on Active SaaS Monitoring
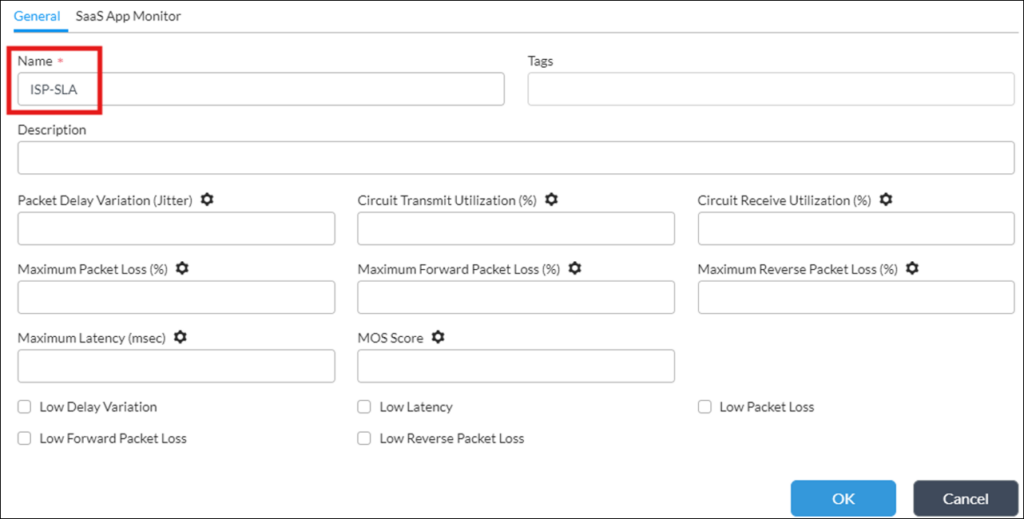
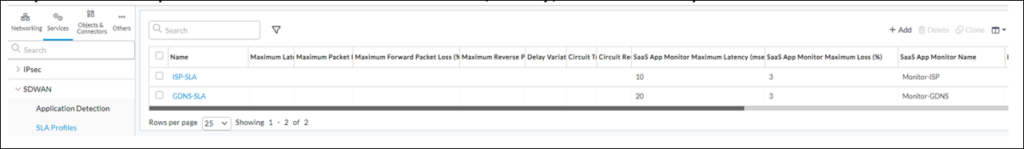
If it’s needed to trigger alarms, when Active SaaS Monitoring performance metrics cross certain thresholds, it can be done using following Approach (applicable only for 22.1 and later releases):1) Configure SD-WAN SLA Profile(s) in Services->SDWAN->SLA Profiles (there should be SLA Profile created for each Active SaaS Monitor):
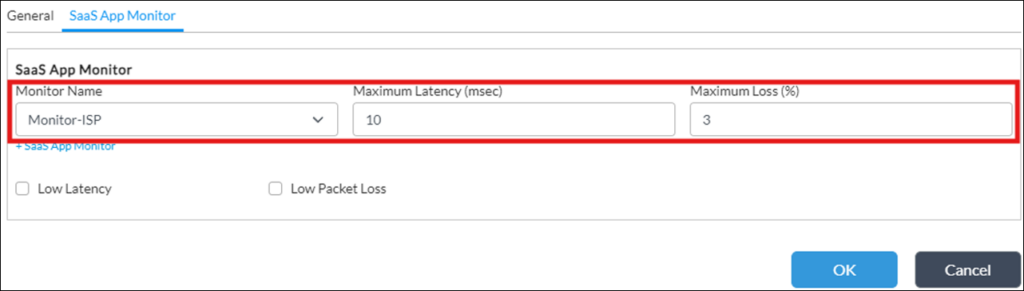
 switch to SaaS App Monitor tab and put desired SLA threshold(s):
 Repeat this step for other Active SaaS Monitors, if any, so that finally the table looks like:
 2) Configure SD-WAN Forwarding Profile(s) in Services->SDWAN-> Forwarding Profiles (there should be Forwarding Profile created for each SLA Profile from the previous step):
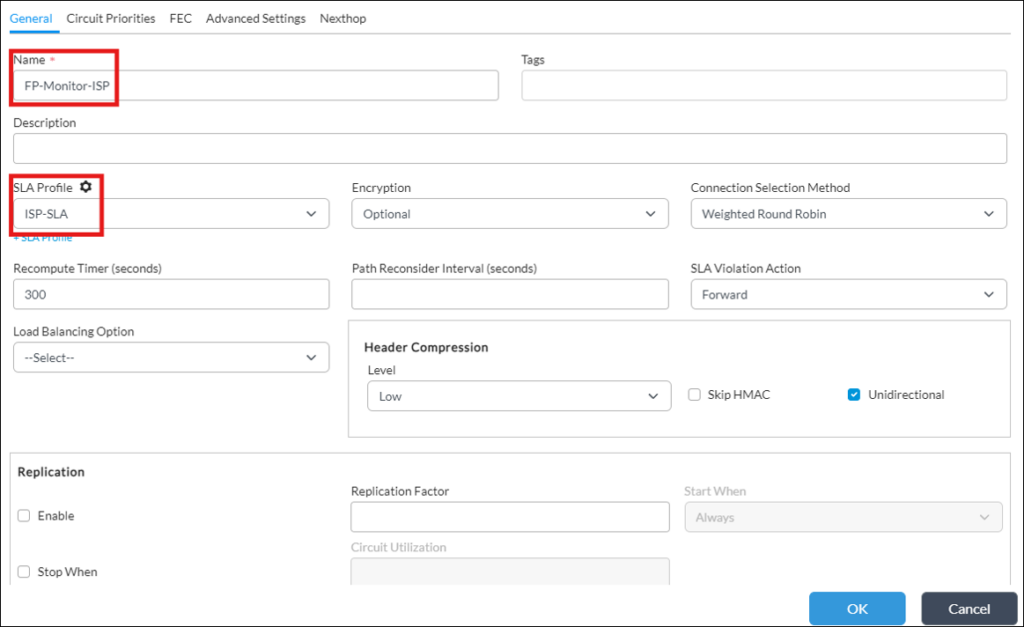 Other values can be left as Default.
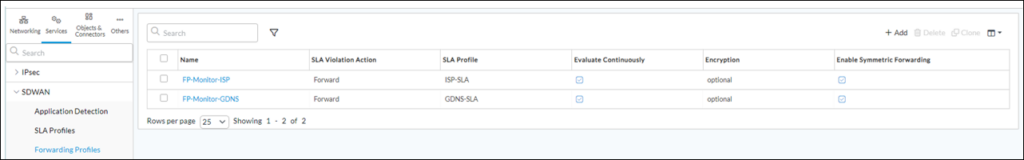
Repeat this step for other SLA Profile(s) from the previous step, if any, so that finally the table looks like:
 3) Create an alarm when configured SLA threshold values are crossed – navigate to Others->Alarms configuration section and add alarm of “nexthop-sla-not-met” type:
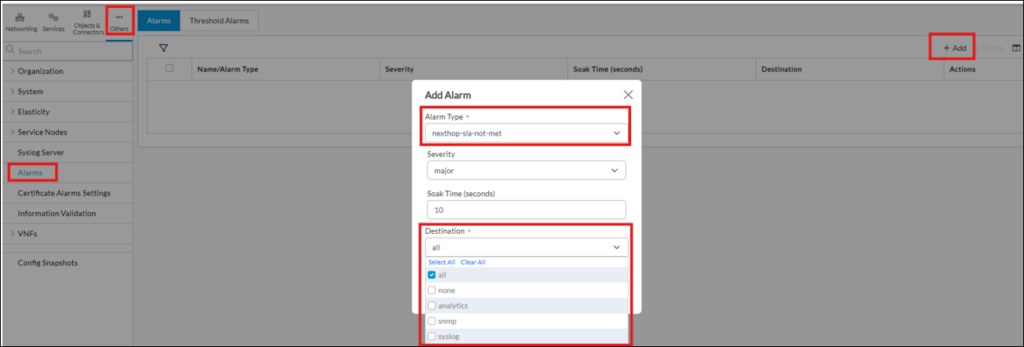 For destination it’s possible to select Analytics, SNMP trap, syslog – depending on the need.
In the next chapter it will be shown, where to find logs for this alarm in Versa Analytics.
For destination it’s possible to select Analytics, SNMP trap, syslog – depending on the need.
In the next chapter it will be shown, where to find logs for this alarm in Versa Analytics.
4) Additionally to SLA violation alarm, it’s also possible to create another alarm, which will be triggered when Active SaaS monitor is down (so it may work even when there is no SLA profile configure with it) – it’s “application-monitor-down” Alarm type:
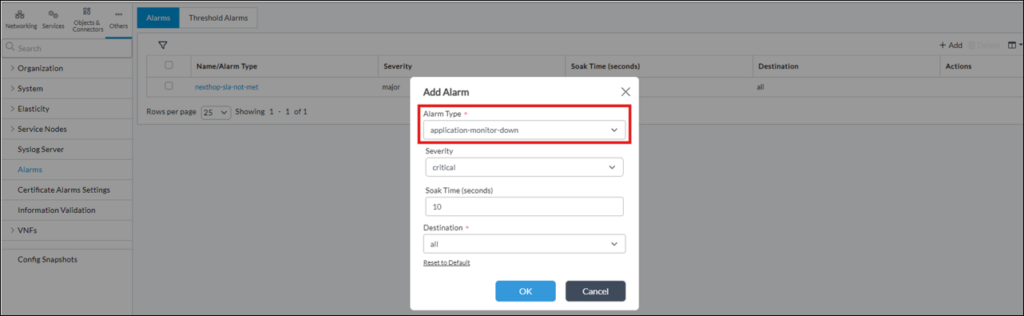 In the next chapter it will be shown, where to find logs for this alarm in Versa Analytics.
4 Observing configured Link Health Alarms in Versa Analytics
Below are the examples of log message related to these alarms, sent to Analytics: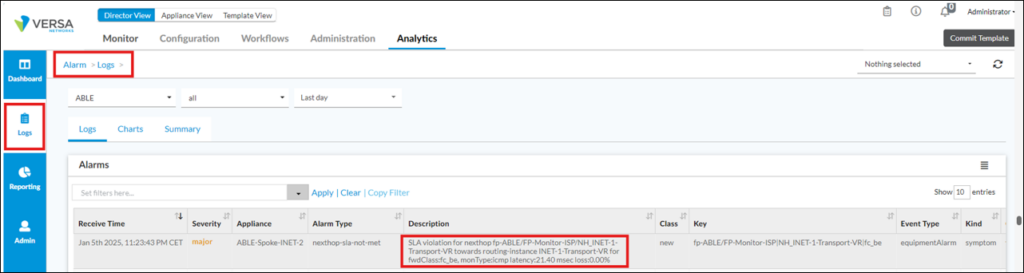

Example log description for “nexthop-sla-not-met” Alarm (note: it records latency and packet loss values, when alarm was triggered):
SLA violation for nexthop fp-<ORG_Name>/<ForwardingProfile_Name>/<NextHop_Transport-VR_Name> towards routing-instance <Transport-VR_Name> for fwdClass:fc_be, monType:icmp latency:X msec loss:Y %
Example log description for “application-monitor-down” Alarm:
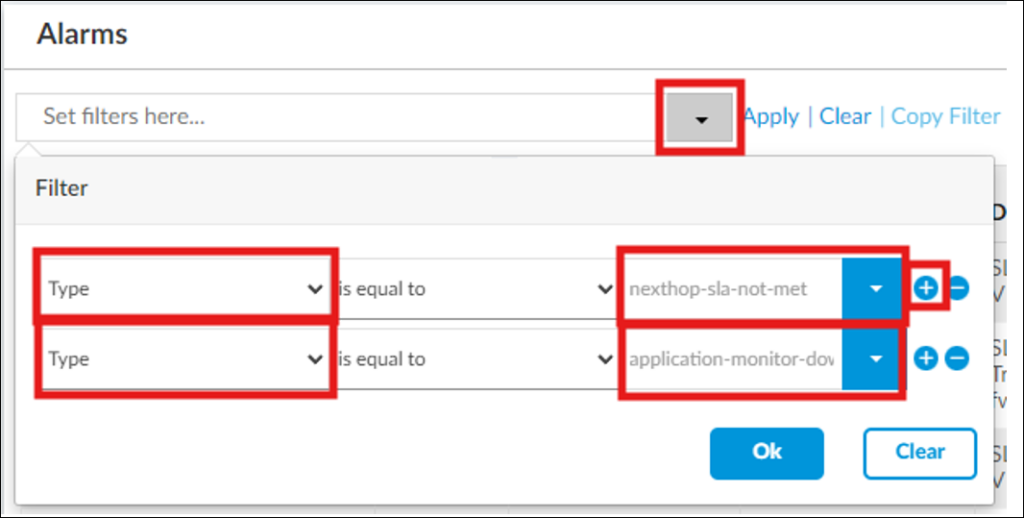
Application monitor <SaaS_AppMonitor_Name> through routing-instance <Transport-VR_Name> is downNote: it’s possible to filter all those alarms in Analytics Logs by applying filter with “nexthop-sla-not-met” OR “application-monitor-down” as Alarm Type: