by Ian Hindley
Overview
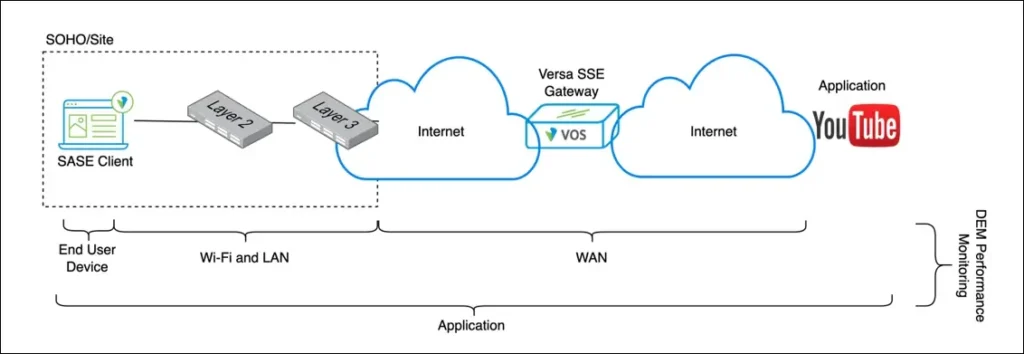
Versa’s Digital Experience Monitoring (DEM) is a component of Versa’s Unified SASE (Secure Access Service Edge) platform. One of its key benefits is continuous performance monitoring across ‘Segments’ as defined in the table below:
| Segment | Performance Metric |
| End User Device/SASE Client | Device Memory; CPU; Disk Utilisation; Battery Life |
| Wi-Fi | Signal Strength; Transmit and Receive Bandwidth per SSID |
| Local Area Networks (LAN) | Delay; Jitter; Loss |
| Wide Area Networks (WAN) | Delay; Jitter; Loss |
| Pre-defined Applications | DNS lookup time; TCP and SSL Connect Time; HTTP Latency; Time to First and Last Byte; Delay; Jitter and Packet Loss to Application Server |
As depicted in the diagram below, the combination of Segments in the table above allows end-to-end performance monitoring between SASE Client and Application to be undertaken:
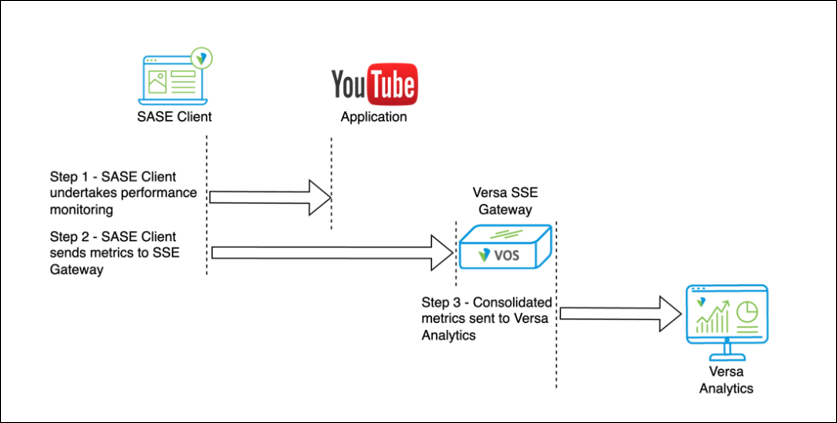
 Performance monitoring is undertaken by the SASE Client. As shown in the diagram below, (step 1) the SASE Client performs end-to-end monitoring of the end users’ networks and application performance through the periodic transmission of synthetic probes and monitoring of the health of the end device itself. These are periodically shared with the Versa SSE Gateway (step 2). These metrics are consolidated by the Versa SSE Gateway and shared with Versa Analytics (step 3). Versa Analytics uses this data to provide network administrators with end-to-end visibility and actionable insights:
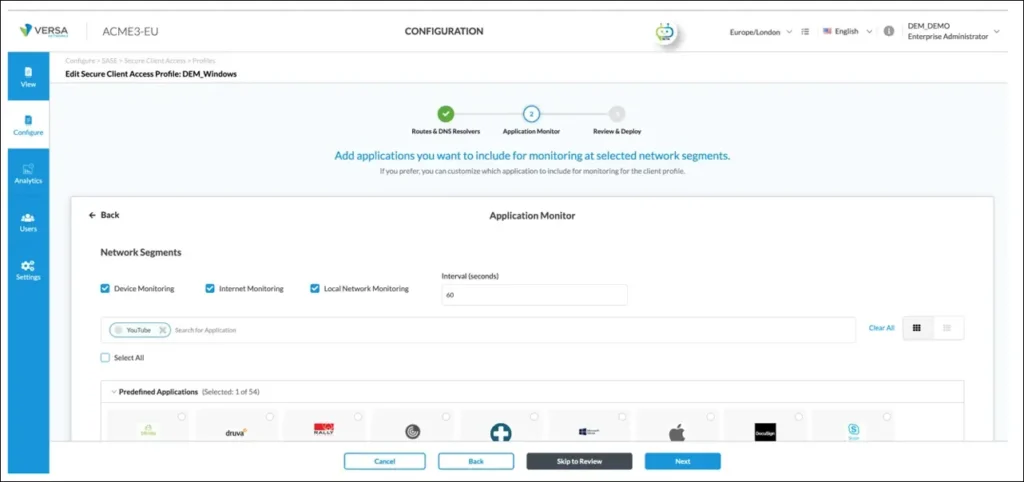
By default, DEM is disabled. DEM is enabled on the SASE Client through the configuration of ‘Secure Client Access Profiles’ in Versa Concerto. In the example screenshot below, DEM has been enabled for the ‘DEM_Windows’ Secure Client Access Profile. Specifically, it has been enabled for:
– Device Monitoring
– Internet Monitoring
– Local Network Monitoring
– Pre-Defined Application Monitoring [1]
Also note the ‘interval’ was set to 60 seconds for the creation of this guide. This isn’t recommended for production networks due to the volume of traffic this can generate. For reference, the default (and recommended) interval is 15 minutes:
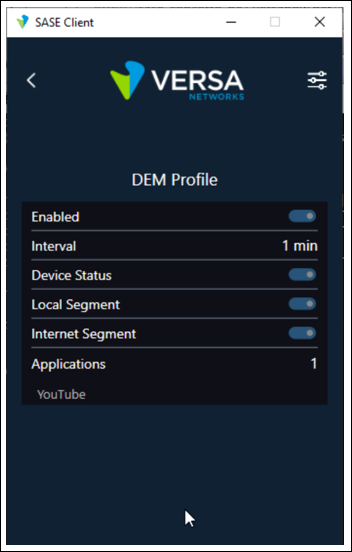
Once the DEM Profile has been created and published to the SSE Gateways, the SASE Client needs to register/reregister to the SASE service. During this process, the SASE Client downloads the DEM Profile created in the screenshot above. Once downloaded, the SASE Client is configured to collect and send DEM information as per the DEM Profile. As an example, the SASE Client below has reregistered and downloaded the DEM Profile configured earlier via the Secure Access Profile. This can be confirmed on the SASE Client by selecting Settings Icon > {tenant name} > Digital Experience Monitoring:
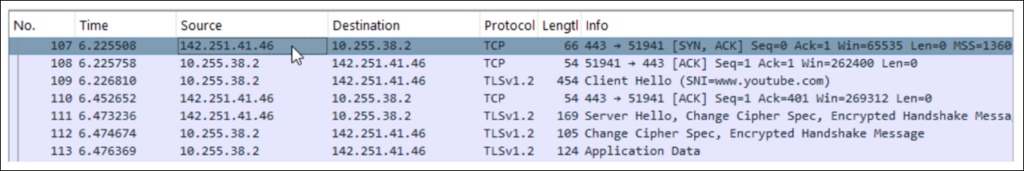
Once enabled, performance monitoring between SASE Client and the application(s) selected in the DEM profile is automatically triggered. As an example, in the following screenshot, a TCP session is established between SASE Client and YouTube before an SSL handshake is performed:
Performance data is then periodically sent to the SSE Gateway where upon it is forwarded to Versa Analytics (which is accessed via Versa Concerto acting as a single pane of glass):
Troubleshooting Scenario 1 – LAN Packet Loss
An end user has recently migrated to their company’s new SASE platform from Versa. Since migration, they believe they’ve been experiencing poor performance when accessing internet-based applications. Additionally, web pages take time to load and appear unresponsive.
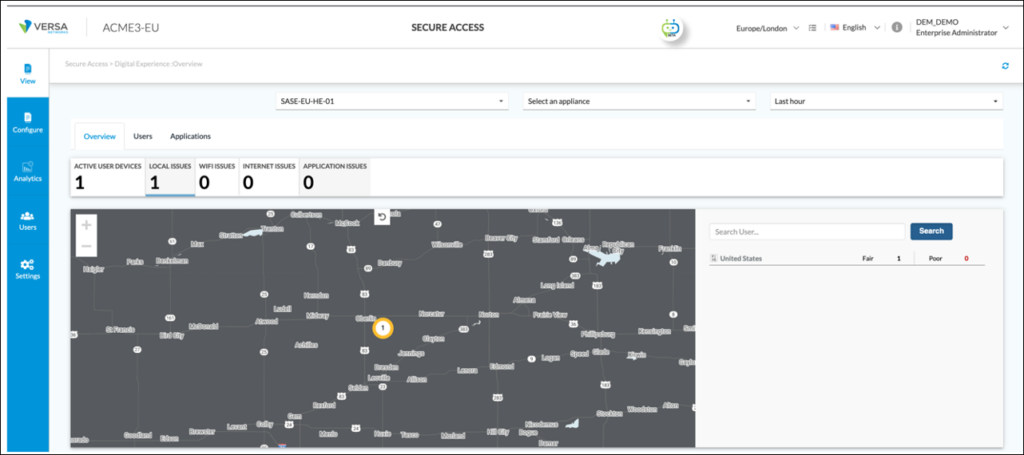
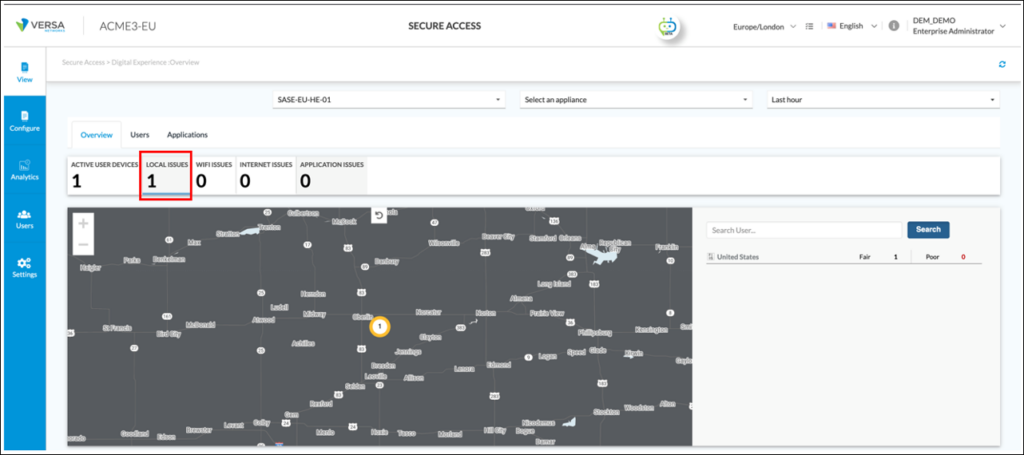
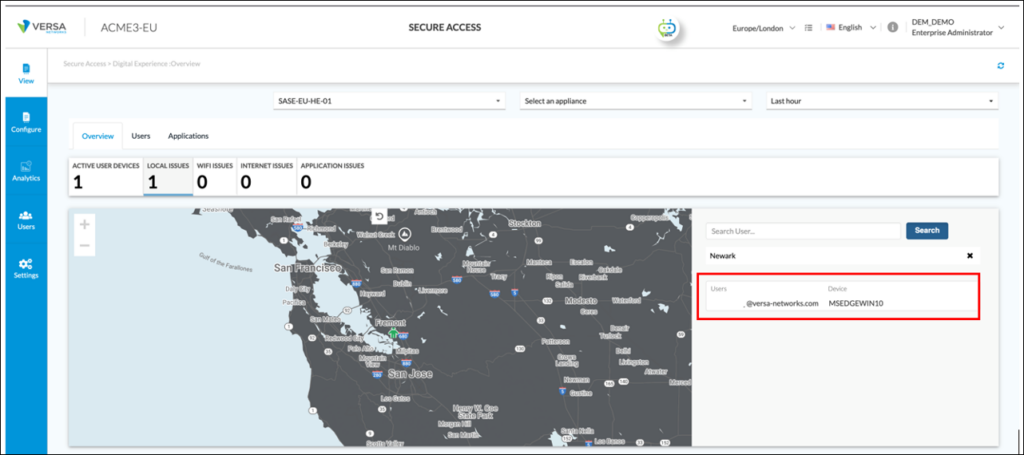
Based on this information, the company network administrator logs into Versa Concerto and navigates to View > Secure Access > Digital Experience [2]. From the ‘Overview’ page, there is one ‘LOCAL ISSUES’. The LOCAL ISSUES tab is selected:
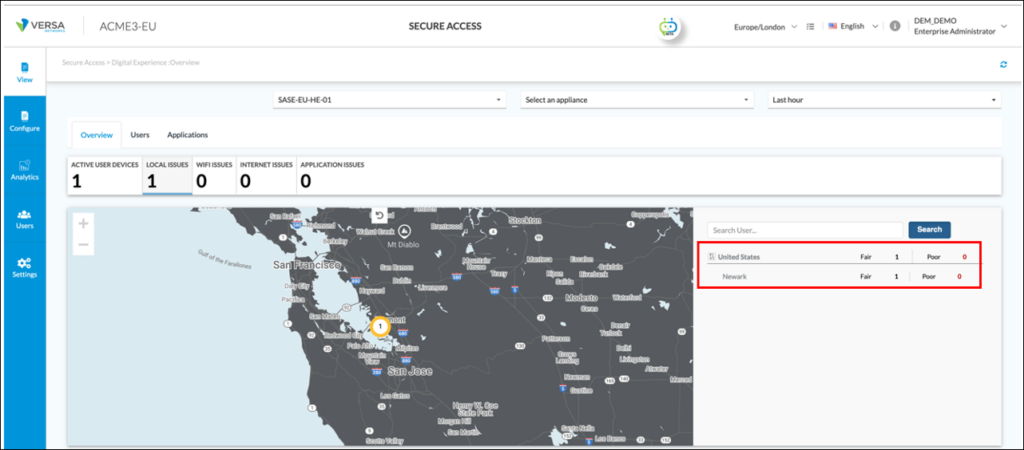
In the United States, there is a ‘Fair’ issue requiring further investigation. By clicking on the Country, the location within the United States can be seen. In this case, the Fair issue is in Newark:
By selecting Newark, the end user experiencing the Fair issue can be identified:
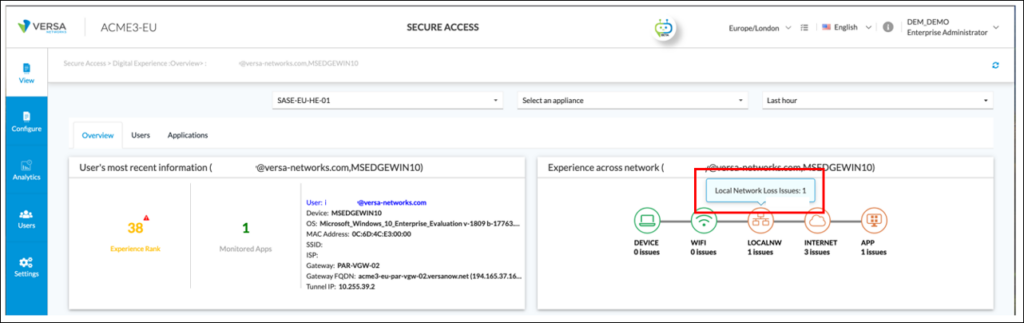
By selecting the user, based on the colour and text description of the ‘Experience across network’ graphic, it can be seen there are ‘LOCALNW’; ‘INTERNET’ and ‘APP’ issues:

The network administrator hovers over the ‘LOCALNW’ icon and the pop-up identifies there are packet loss issues on the local network of the end user:
The network administrator scrolls down to the “Local network loss over time” graph to understand more about the loss:
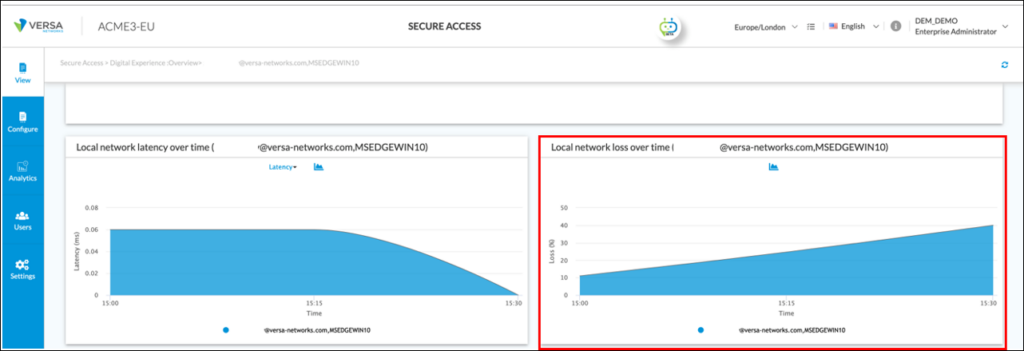
As shown by the graph above, in the last 30 minutes of monitoring, packet loss on the local LAN of the end user has increased from 10% to over 40%.
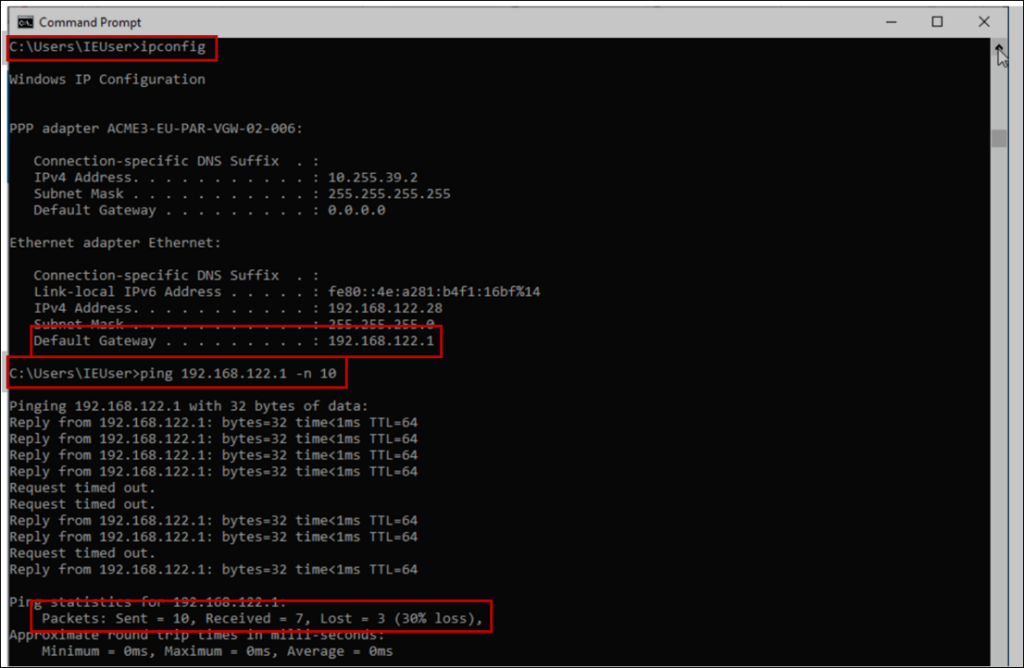
To confirm local LAN issues, the Network Administrator asks the end user to perform a ping on their end device to their LAN default gateway. In the first step, they determine the default gateway on the users LAN via ipconfig. In the second step, the user was asked to ping their default gateway (192.168.122.1). As shown, 10 pings resulted in a 30% packet loss. This confirms the packet loss findings from DEM:
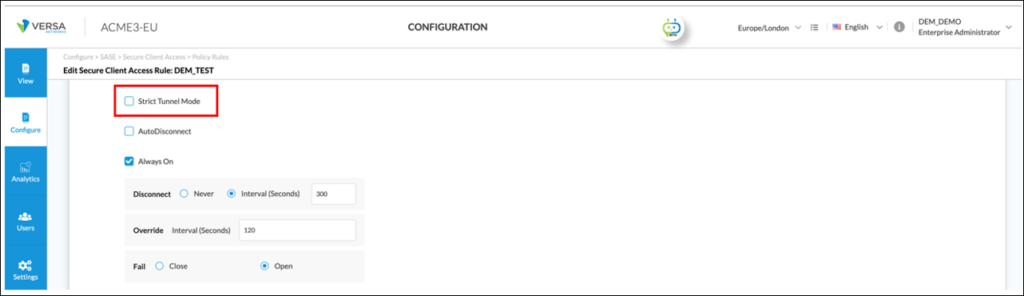
According to Secure Client Access configuration, ‘Strict Tunnel Mode’ is disabled for the SASE Client (see screenshot below). This means pings to the end users LAN default gateway are not handled by the new SASE client. In other words, pings between end users’ device and LAN default gateway are sent without using the SASE client. Therefore, the end users’ poor performance experience and the reason web pages take time to load and appear unresponsive is due to local LAN issues and purely coincidental to the company SASE migration.
In summary, using DEM, the network administrator isolated the fault to the local LAN and is now able to perform further diagnostics to diagnose the issue.
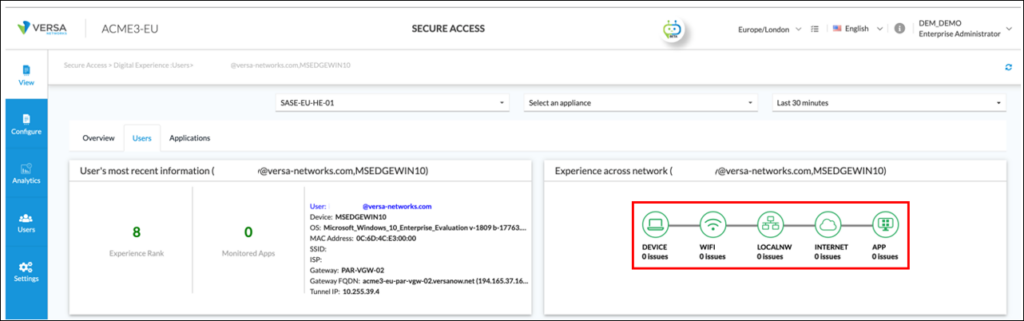
Although an earlier screenshot also showed INTERNET and APPLICATION issues, it is recommended issues are resolved from the client outwards. For example, packet loss on the LAN could also affect INTERNET and APPLICATION performance. Therefore, it is recommended the Network Administrator resolve the LAN issues first before investigating the WAN and application. In this example, once the LAN issue was resolved, INTERNET and APP issues were also resolved without further investigation/resolution. Therefore, it was concluded the LAN issue was also impacting INTERNET and APP performance. This is demonstrated in the screenshot below where the end user is no longer experiencing issues on INTERNET or APP once the local LAN issue was resolved:
(For reference, the local LAN issue was caused by a duplex mismatch between end user device and local switch. Although the end user device was auto-negotiating speed/duplex, the switch was configured with a specific speed/duplex setting causing collisions on the LAN).
Troubleshooting Scenario 2 – Poor Application Performance
A SASE end user has reported poor application performance when they travel to the United States compared to their usual location from the United Kingdom. Specifically, when connected to the SASE service, they noted downloading files takes significantly longer when in the United States compared to the United Kingdom. This was particularly surprising as the end user device is connected at higher speeds in the United States compared to the United Kingdom.
For brevity, the network administrator has already found there are no end device (e.g. CPU) or LAN (e.g. packet loss) issues by monitoring DEM performance metrics. Focus is now on application performance. In this scenario, DEM can be used to compare application performance when the user is in the United States versus the United Kingdom.
In the table below, the application performance of YouTube whilst the user was in the United States was captured:

By comparison, the application performance of YouTube whilst the user was in the United Kingdom was captured:
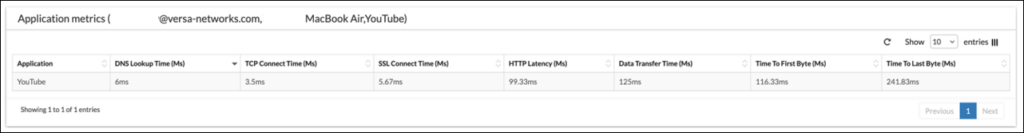
Both tables show a common trend. All activities, when the end user is in the United States, takes longer than in the United Kingdom. For example, DNS lookup Time is 27.04ms compared to 6ms.
Focussing on ‘Application network stats’ (see screenshot below), delay (also known as network latency) is more than five times higher when the user is in the United States compared to the United Kingdom:
– Delay from the United States is typically 220ms. Also note in the screenshot below, this is typical regardless of the application destination IP address being monitored. This detail confirms it’s not an application server specific issue as all servers show a similar latency value:
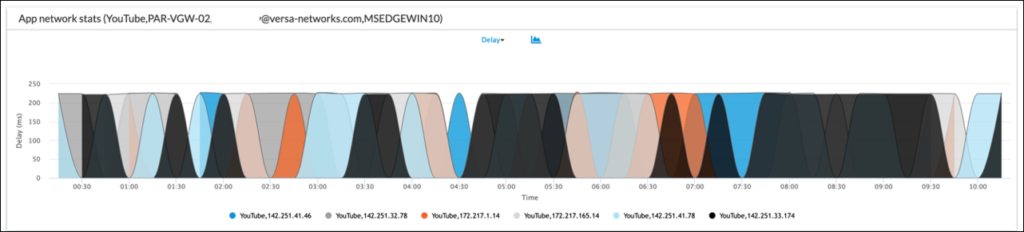
– Whereas delay from the United Kingdom is typically 45ms

Latency/Delay has a significant impact on data throughput in network communications and specifically impacts the bandwidth-delay product. As a refresher, TCP expects the SASE Client to acknowledge every X bytes it has received. It takes time for the acknowledgement to reach the application server and for the data sent by the application server to reach the SASE Client. The sum of these time periods is known as round trip time (RTT). The number of bytes transmitted prior to the acknowledgement is known as the window size. In addition, most operating systems support window scaling. This means a TCP client acknowledges every X bytes multiplied by the window scaling factor. For example, if the window size is 32 kB and the window scaling factor is 8, then an acknowledgement is sent every 256 kB of data.
Based on this information, the anticipated throughput from a single TCP stream can be significantly impacted by latency as shown in the table below. It shows, as latency increases, the anticipated throughput drops[3]:
| Link Bandwidth (Mbit/s) | Round Trip Time (RTT) ms | Anticipated Throughput from single TCP Stream (Mbps)[4] |
| 100 | 10 | 4.26 |
| 100 | 100 | 0.62 |
| 100 | 1000 | 0.07 |
Based on this information, the network administrator can compare anticipated throughput based on actual latency values reported by DEM. They can then compare the user connected in the United States versus the same user connected in the United Kingdom:
| Location | Link Bandwidth (Mbit/s) | Round Trip Time (RTT) ms | Anticipated Throughput from single TCP Stream (Mbps)[5] |
| United States | 1000 | 220 | 0.30 |
| United Kingdom | 100 | 45 | 1.30 |
Therefore, even though the available bandwidth in the United States was higher than the United Kingdom (1Gbps vs. 100Mbps respectively), the anticipated throughput from a single TCP stream was 4x lower due to the additional latency experienced between SASE Client and application when the end user was connected in the United States.
Poor throughput caused by high latency appears to be the case for this user when comparing connectivity from the United States to the United Kingdom. But why was latency higher for this application from the United States?
One reason for high latency is the company the end user is employed by is European based. As such, the SASE service they purchased is based on SSE Gateways hosted in Europe. Their company didn’t extend the service to SSE Gateways in the Americas. Therefore, when the end user travels to the United States, their client connects to the best gateway using Versa’s best gateway algorithm[6] but only between SSE Gateways based in Europe as this is the geographical coverage the company purchased.
A second reason for high latency is the path taken between SSE Gateway and Application. From an application traceroute point of view between end user and YouTube, traffic traverses 15 hops as shown below:
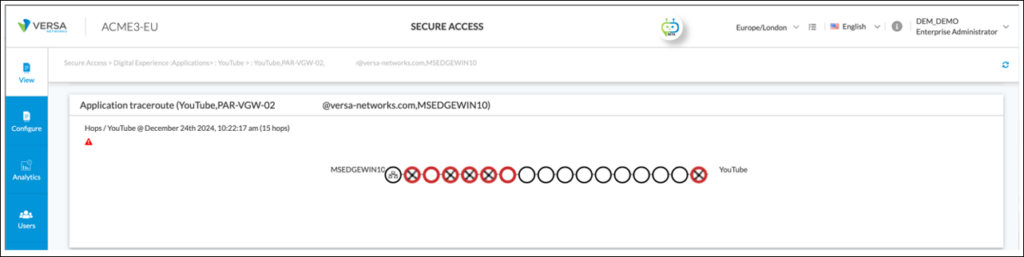 By hovering over each hop in the screenshot above, the location; latency; jitter and loss of each hop can be assessed . As shown by hops 7; 10; 11 and 13 in the screenshots below, traffic passes from Paris (France) to London (UK) to New York (US) and finally to a YouTube server hosted in Toronto (Canada). This global path is creating additional latency when the end user connects to an SSE Gateway in Europe and accesses YouTube in Canada:

To address the application latency challenge for this user, there are several options available to the network administrator:
– Add geographical areas to the SASE service to reduce latency and improve application throughput and end user experience
1. Additional geographical areas provide local connectivity options for end user devices. The advantage of this approach is traffic is still under SASE control and maintains the security posture of the company whilst at the same time reducing application latency for end users and improving end user experience
– Or configure Secure Client Access profiles for end users outside Europe[8]
1. These optimise end user experience when accessing applications such as YouTube. In such cases, a split tunnel at the client ensures YouTube traffic is broken out locally and doesn’t traverse the SASE platform. Consequentially, latency is reduced which improves application throughput and end user experience. The disadvantage of this approach is locally broken out traffic is no longer under SASE control which reduces the security posture of the company
Summary
Versa’s Digital Experience Monitoring (DEM) is a component of Versa’s Unified SASE (Secure Access Service Edge) platform. One of its key benefits is continuous performance monitoring across ‘Segments’. Although not enabled by default, DEM can be used for troubleshooting performance related issues between SASE client and applications. In this paper, two scenarios were described as examples of how a network administrator can use DEM for troubleshooting performance related issues. In the first scenario, DEM identified packet loss on the clients LAN. In the second scenario, DEM identified high latency between SASE client and application. In both scenarios, DEM in conjunction with Versa Analytics provided end-to-end visibility and actionable insights.
[1] For this example, YouTube has been selected (although other pre-defined applications may be optionally selected)
[2] Prior to troubleshooting, the network administrator had already enabled DEM monitoring as per the steps described earlier
[3] The reader is encouraged to research TCP Bandwidth calculators on the Internet to verify for themselves this statement
[4] Throughput based on window size of 8191B and Window Scaling size of 8. (This provides an effective window size of 65528B). MTU of network medium is 1500B. TCP/IP overhead is 40B.
[5] Uses same assumptions as [4] above.
[6] More information can be found here – https://docs.versa-networks.com/Security_Service_Edge_(SSE)/Configuration_from_Director/Versa_SASE_Client/Configure_Versa_SASE_Client_To_Select_the_Best_Gateway
[7] For reference, red circles with a black cross represent ‘no response’ hops. This could occur for many valid reasons. For example, ICMP packets may be explicitly dropped by the next hop device. Red circles without a cross represent an issue with that hop. The issue could relate to latency, jitter or loss or any combination of these three-performance metrics and requires further investigation
[8] Secure Client Access policy can be created matching on geo-location


