
Application Performance Monitoring
Application Performance Monitoring (APM) is the process of tracking session establishment and providing monitoring information that is more representative of the user experience than the generic active network probes. Generic probes provide only limited details about application performance. For instance, an ICMP probe can just measure round trip delay and loss at the network layer.
A key benefit of SD-WAN is enhanced visibility and this is where APM and real-time monitoring play a key role and are more representative of the user experience.
VOS is a session-based appliance therefore it is aware of each flow/session and various attributes related to the flow. VOS intelligently analyzes this information to gather more insight into its performance and potential user experience.
Versa Analytics provides a raft of utilization information at the site, user, and application level. However, APM goes further to provide a view of the ‘Performance’ of each application.
APM is based on TCP monitoring, and it performs a passive application monitoring – or single-ended measurements of the TCP metrics.
APM measures the following metrics
– Connection Setup Time
– Server Connection Reset Rate
– Application Response Time
– Retransmission Time
– Round-Trip Time
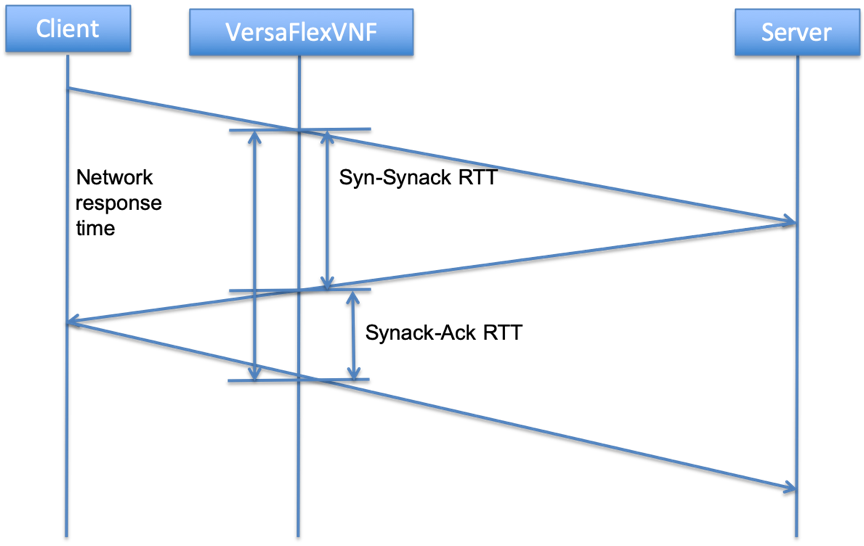
APM tracks the timestamps between the SYN – SYN-ACK (SSA), SYN-ACK-ACK (SAA) messages and the SYN-to-ACK network response time (NRT) to perform its analysis.
The following diagram gives the message flow between the various Versa SD-WAN Components while performing APM.
Configuration
Objectives:
Create an APM Policy –
A. Identify and match interesting traffic for APM
B. Create a rule to enable TCP monitoring
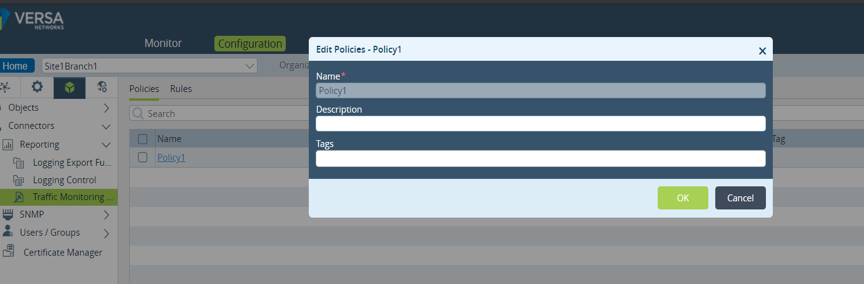
Step 1: Create an APM Policy.
APM Policy can be created under Objects & Connectors > Connectors > Reproting > Traffic Monitoring
Create a Policy by name 'Policy1'
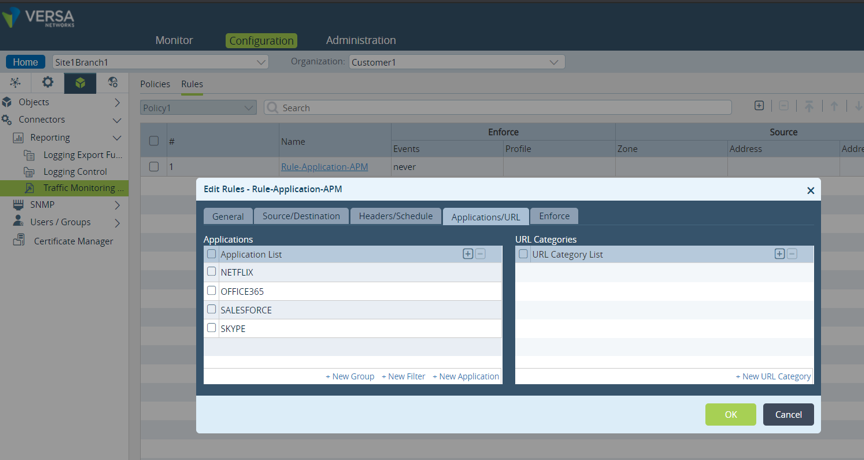
Step 2: Define the Applications or Prefixes of interest that have to be matched for APM.
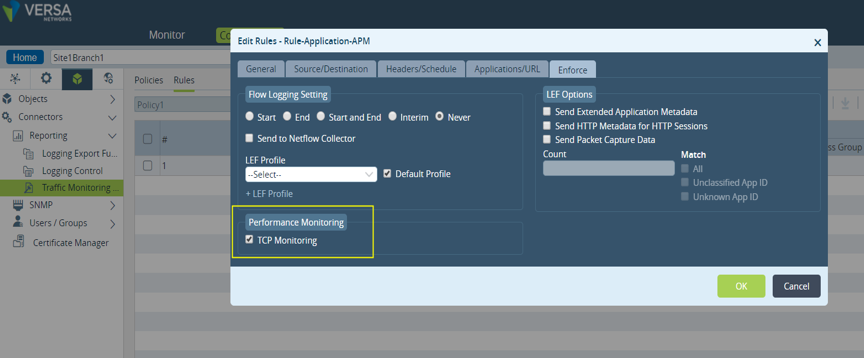
Step 3: Enable 'TCP Monitoring'
Enable TCP Monitoring in the 'Enforce' tab and enable logging.
Verification
APM logs can be verified on the analytics under the SDWAN Analytics data.
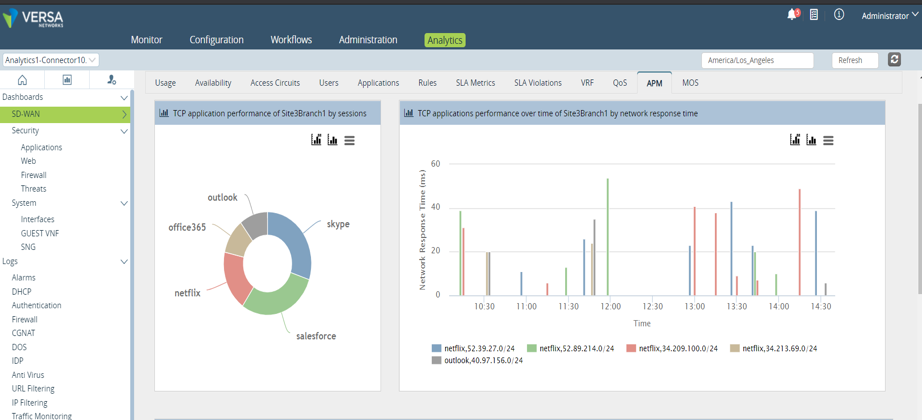
The Analytics logs show the APM summary logs and the Network Response Time (NRT) for the applications of interest.
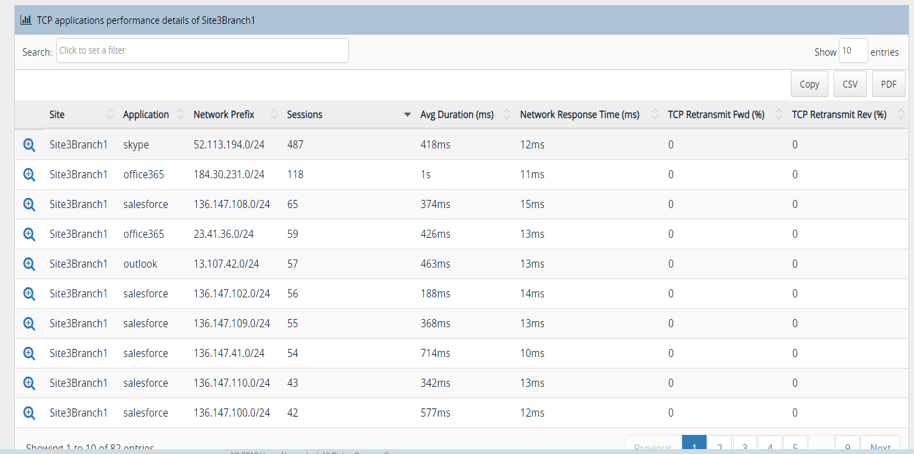
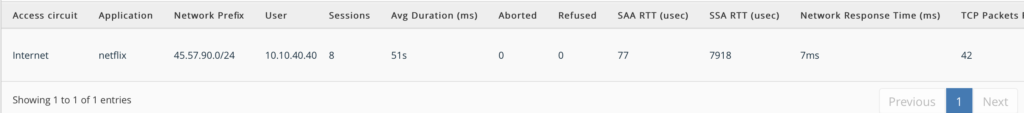
A drill-down of the logs shows the details of the session and the different response times inside each session SSA, SAA and, other APM metrics, etc.

